Power BI is one of the most popular business intelligence tools on the market — and for good reason. It’s visual, intuitive, and empowers users to create reports and dashboards with ease.
But for anyone serious about building impactful analytics solutions, here’s a truth that’s rarely discussed:
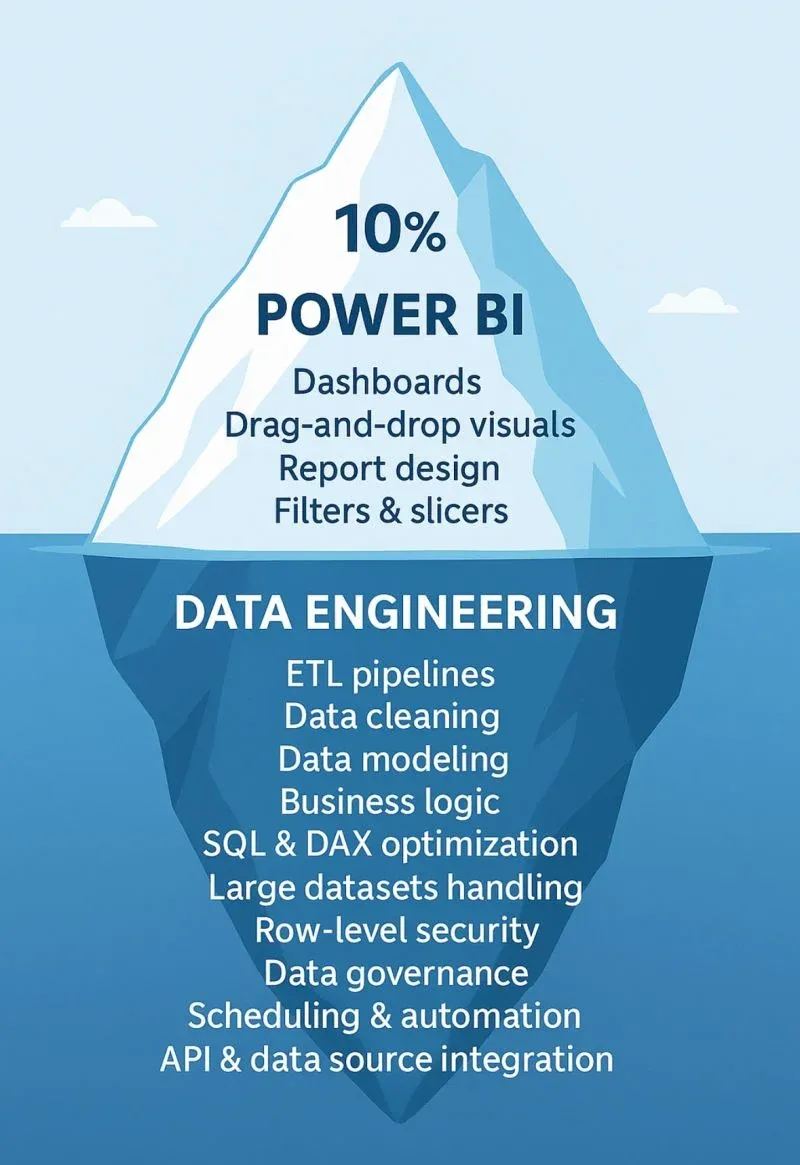
Power BI is only 10% of the actual work.
Most of the heavy lifting happens long before the first bar chart is ever built. The dashboard is just the visible surface of a much deeper ecosystem — and that’s where the real skill lies.
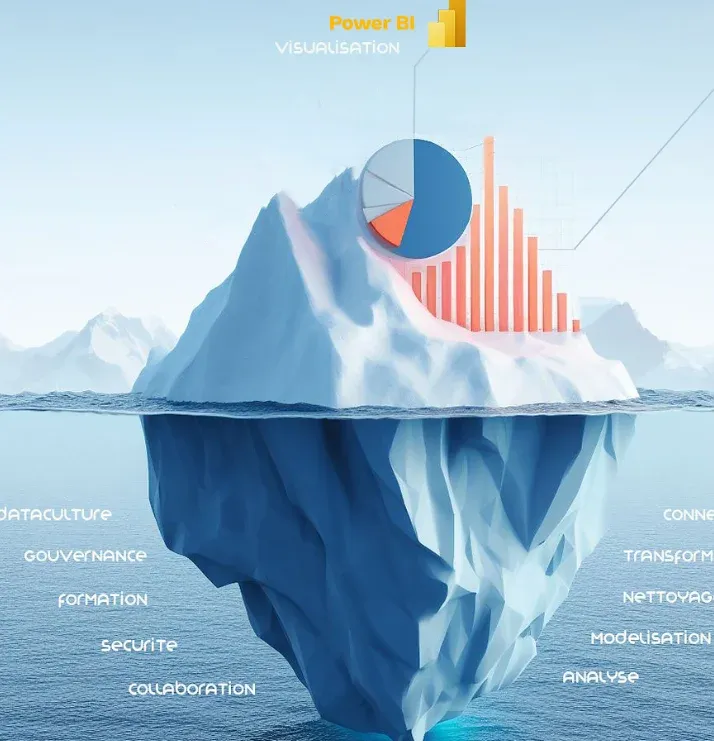
Beneath the Surface: True Value is Created
Let’s visualize it like an iceberg.
What most people see and focus on:
Dashboards
Drag-and-drop visuals
Report design
Filters and slicers
This is the 10% above the water — accessible, quick to learn, and great for storytelling. But under the surface lies the other 90%— the data engineering foundation that makes Power BI truly powerful.
This includes:
-
ETL Pipelines: Extracting, transforming, and loading data from various sources (often messy and unstructured).
-
Data Cleaning: Ensuring accuracy, consistency, and removing noise before analysis begins.
-
Data Modeling: Structuring the data in a way that supports fast, scalable querying.
-
Business Logic Translation: Understanding what the stakeholders really want — and converting that into logic and rules.
-
SQL and DAX Mastery: Writing efficient queries and calculations to power meaningful insights.
-
Governance and Security: Implementing row-level security, user access, compliance, and governance best practices.
-
Automation and Refresh Schedules: Ensuring reports stay up to date without manual intervention.
This foundational work often goes unnoticed — but without it, Power BI visuals are just smoke and mirrors.
Solve Business Problems
If you’re learning Power BI solely to make beautiful dashboards, you’re playing a short game.
In reality, organizations don’t need more pretty charts. They need business impact. That means:
Pinpointing inefficiencies
Identifying cost-saving opportunities
Enabling faster, data-driven decisions
Aligning metrics to business goals
And achieving that requires more than design skills — it requires data intuition, technical fluency, and architectural thinking.
A great Power BI professional isn’t someone who just knows how to use visuals — it’s someone who understands:
-
Where the data comes from
-
How to prepare it for analysis
-
What metrics actually drive the business
-
How to communicate insights effectively to stakeholders
This is what separates Power BI users from Power BI professionals. The next time you open Power BI, remember this: you're not just building charts — you’re building solutions.
So don’t stop at visuals. Learn the stack. Dive into data modeling, explore ETL, sharpen your DAX, and study real business use cases.
Because in the world of analytics, the most valuable work happens below the surface.